How to prepare chart & table -overview-
2021/9/13 キャプションに関して追記
hver 1.0 (28 Sep 2019, by nogi)
Samples are here. Let’s check !!
「伝わるデザイン 表とグラフ」
https://tsutawarudesign.com/miyasuku1.html
“10 Do’s and Don’ts of Infographic & Chart Design”
https://venngage.com/blog/chart-design/
“Chart Design Principles”
https://datavizforall.org/chart-design.html
The top ten worst graphs
https://www.biostat.wisc.edu/~kbroman/topten_worstgraphs/
A basic rule
Which Font Looks Best in a Figure?
https://pubs.acs.org/doi/10.1021/acs.chemmater.6b00306
7 rules
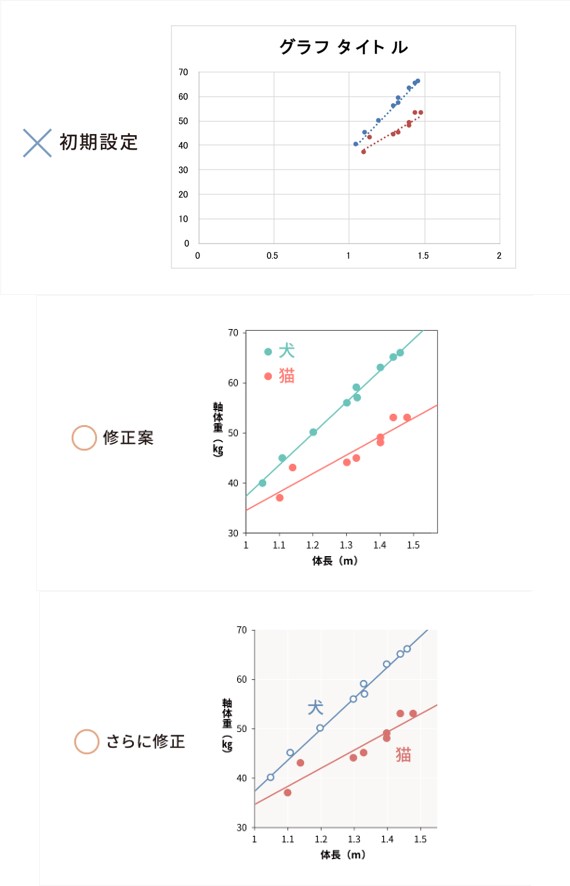
0. Never use the default charts & tables in excel
0. Excelの表・グラフは必ず編集する(初期設定のまま使用しない)
1. Do use the right chart for your data
1. 適切なグラフ種類を選ぶ
2. Write the axis name and the unit
2. 軸の名前、単位を記入する
3. Change the area size (6-8cm wide) and its aspect ratio (golden ratio/ square).
3. グラフエリアのサイズ(幅6-8cm)、縦横比(黄金比・正方形)を変更する。
4. Font size should be larger as much as the text size.
4. グラフ文字は、サイズを大きくする(文章文字サイズと同じ程度に)
5. Choose colors wisely. (No random color. Monochrome is the best)
5. 色やパターンを適切に変更する(ランダムカラー厳禁。モノクロで識別できるのがベスト)
6. The data information is to label directly on the chart, not use the legends.
6. 凡例を使用せず、直接データ情報はグラフに直接記入する。
https://tsutawarudesign.com/miyasuku1.html
7. Write the caption for all the graph & tables.
7. グラフ・表にキャプションを書く!


© Department of Functionalized Natural Materials ISIR, Osaka University